
Assessing the case for a V-shaped recovery
 Simon Ward
 Post a Comment
The current global recession is shockingly severe. Does this imply an increased risk of “depression” or will an equally-dynamic recovery unfold later in 2009?
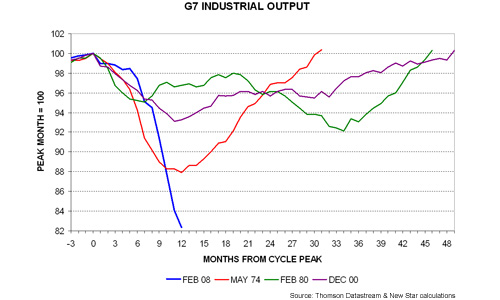
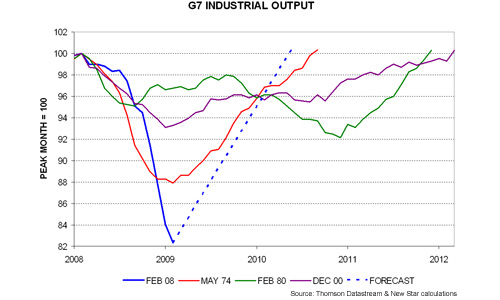
The first chart below updates a comparison of the current fall in industrial output in the Group of Seven (G7) economies with the three largest declines over the prior 50 years. Output is now about 18% below its peak in February 2008 – significantly greater than the biggest previous drop of 12% in 1974-75.
In the three prior cycles there was an inverse relationship between the size of the peak-to-trough output fall and the time taken to retrace it – the bigger the decline, the faster the recovery. It took 31 months for output to regain its peak level in the mid 1970s but 49 months in the early 2000s, when production fell by “only” 7%.
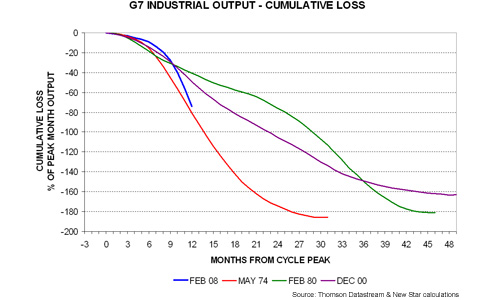
Commenting on an earlier post, a reader noted that the areas between the curves and the 100% horizontal line look similar. This area measures the cumulative percentage loss of output relative to its peak monthly level. This cumulative loss is shown in the second chart. The reader’s observation is correct. The loss was 186% over 1974-76, 181% over 1980-83 and 163% over 2000-04 – a remarkably narrow range.
So a bigger peak-to-trough decline may not imply that a recession is significantly worse in terms of cumulative output loss. There may be natural forces tending to equalise this cumulative loss across cycles. This observation, however, may apply only to “normal” recessions. Once the output fall exceeds a certain amount, the dynamics may change, resulting in a recession developing into a depression or slump.
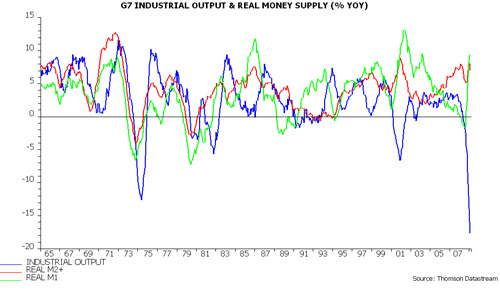
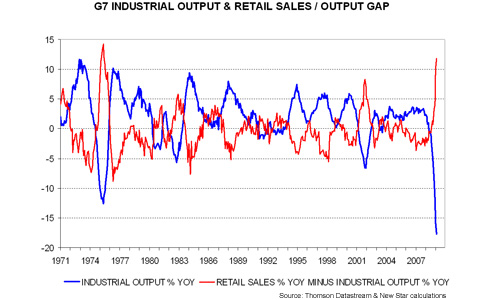
The case for a V-shaped revival later in 2009 is that this tipping point has yet to be reached and unprecedented monetary and fiscal policy stimulus will strongly reinforce natural recovery tendencies. Optimistic indicators include a surge in inflation-adjusted narrow money growth – third chart – and a widening gap between sales and production – fourth chart – suggesting a potential big boost from the stocks cycle.
The cumulative loss approach outlined above can be used to generate a forecast path for G7 industrial output in an optimistic economic scenario. Specifically, assume that:
1. The cumulative output loss in the current recession / recovery cycle is 200% (i.e. slightly greater than over 1974-76).
2. February 2009 proves to be the trough.
3. Output subsequently recovers at a constant rate.
These assumptions define the forecast path shown in the fifth chart, which implies a return of output to its February 2008 peak by June 2010.
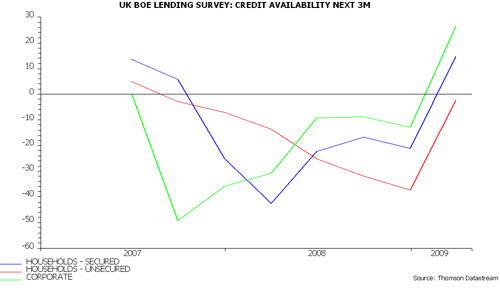
A key argument against a V-shaped rebound in output is that credit supply constraints will short-circuit natural recovery tendencies and render policy stimulus ineffective. Surveys of bank loan officers will be important for judging if credit conditions are easing, boosting economic prospects. The latest Bank of England survey, released today, was encouraging – final chart.
 View Printer Friendly Version
 Email Article to Friend
Reader Comments