
UK M4ex distorted but money trends still alarming
 Simon Ward
 2 Comments
UK money trends are recessionary / deflationary but not as disastrous as suggested by the Bank of England’s M4ex broad money measure, which plunged 4.2% in the year to September after a 0.6% annual decline in August.
M4ex includes money holdings of non-bank financial corporations (excluding intermediaries such as central clearing counterparties, hence M4ex). These holdings surged in September 2022 as LDI funds scrambled to raise cash to meet collateral requirements, creating an unfavourable base effect for the annual M4ex change in September 2023.
The long-standing practice here has been to focus on non-financial monetary aggregates, where available, because movements in financial sector money holdings can be erratic and usually have little bearing on near-term economic prospects.
Non-financial M4, encompassing money holdings of households and private non-financial businesses, fell by 0.1% between August and September for an annual decline of 0.7% compared with 0.3% the previous month – see chart 1.
Chart 1
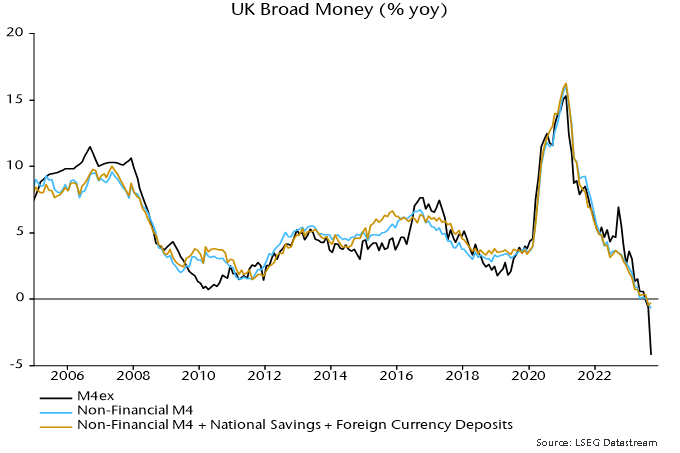
The monthly movements in M4ex and non-financial M4 in September were depressed by savers shifting funds out of bank deposits into high-yielding National Savings growth bonds (now withdrawn). The impact of National Savings flows on annual changes has been minor, however: an expanded non-financial measure including National Savings and foreign currency deposits fell by 0.3% in the year to September – chart 1.
The LDI crisis distortion to the annual M4ex change will unwind in October / November – money holdings of non-bank financial corporations declined by £51 billion in October / November 2022 after a £65 billion jump in September.
 View Printer Friendly Version
 Email Article to Friend
Reader Comments (2)
Alarming indeed. I think it would be useful to have a much longer date axis on your charts.
This cycle is possibly reminiscent of the the late 80s to early 90s that saw significant unemployment and a housing bear market that lasted 6 years.
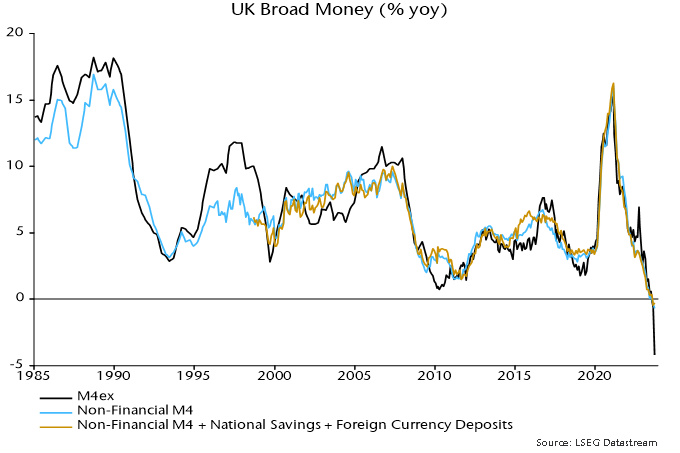
Please see longer-term chart appended to original post.