
Chinese weakness due to policy misstep
 Simon Ward
 1 Comment
Pessimistic commentators argue that the Chinese economy has entered a “liquidity trap” and faces Japan-style deflation. This assessment is not shared here: a recent monetary slowdown can be explained by misguided policy tightening around end-2022, which is now being reversed, while broad money growth would need to fall much further to suggest a sustained decline in prices.
A review of monetary policy in recent years is helpful in understanding current conditions. An important consideration is that – like the Fed decades ago – the PBoC does not announce changes in its policy stance, which often become apparent only after the event in movements in money market rates and credit / monetary trends.
The PBoC eased policy between late 2020 and summer 2022 to cushion covid-related economic weakness. Three-month SHIBOR fell from over 3% to 1.5%, while six-month growth rates of money and credit began to pick up from mid-2021 – see charts 1 and 2.
Chart 1
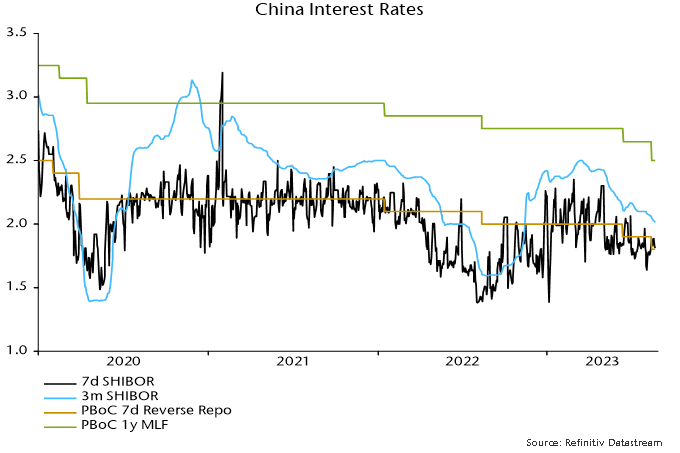
Chart 2
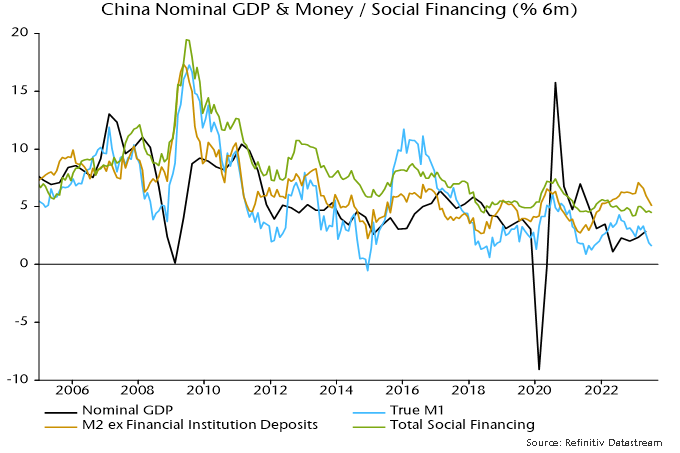
Narrow and broad money measures continued to accelerate in H1 2022, laying the foundations for a solid post-reopening economic recovery in H1 2023 – real GDP grew by 6.1% annualised between Q4 2022 and Q2 2023.
The PBoC, however, blotted its copy book in late 2022, tightening policy on misplaced concern about a reopening-driven inflation pick-up, although narrow money and credit growth were by then cooling and the ratio of broad money to nominal GDP was close to trend (in contrast to the US / Europe, where a large monetary overhang fuelled strong price pressures).
Three-month SHIBOR rebounded from 1.7% in September to 2.4% by year-end, rising further to 2.5% in March. The consensus view at the time – not shared here – was that the rise in money rates reflected stronger money demand due to reopening, i.e. the increase was “endogenous” rather than policy-driven and would not threaten economic prospects.
Policy tightening has resulted in six-month narrow and broad money growth falling to late 2021 levels, although credit expansion has declined by less (despite a very weak July flow number) – chart 2. The monetary slowdown suggests a loss of economic momentum through late 2023.
The PBoC has, at least, been swift to recognise its error, resuming easing in early Q2. Three-month SHIBOR has retraced half of its August-March rise but may need to return to the low to offset recent monetary damage.
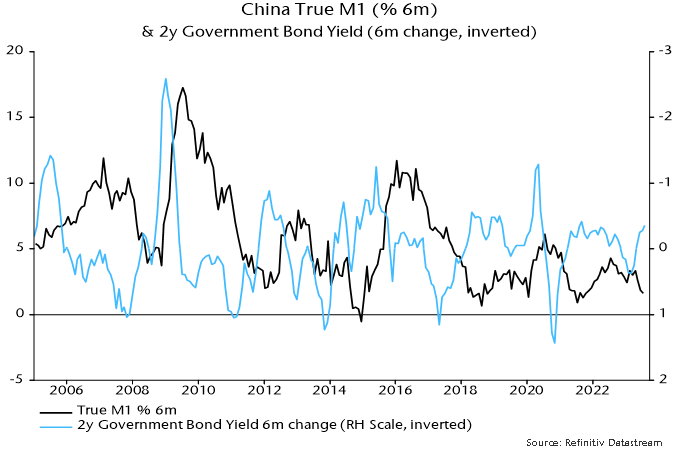
Chart 3 illustrates the inverse leading relationship between changes in interest rates (in this case the two-year government yield) and narrow money momentum. The reversal in rates suggests a bottoming out and revival in money momentum, although timing is uncertain.
Chart 3
Why did Japan enter a sustained deflation in the early 1990 and are there parallels with current Chinese conditions?
From a monetary perspective, a deflationary environment requires (broad) money growth to fall below the sum of trend real GDP growth and the trend rise in the money / nominal GDP ratio.
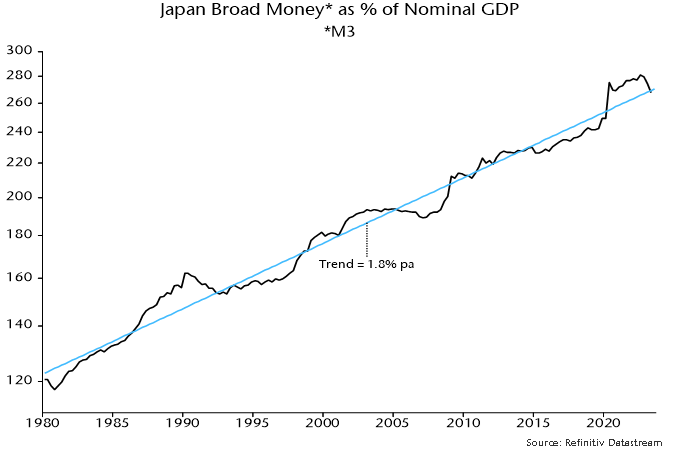
The ratio of Japanese broad money M3 to nominal GDP has risen by 1.8% pa on average over the long run – chart 4. Trend real GDP growth was running at about 2% in the early 1990s, so broad money needed to expand by about 4% pa to maintain stable prices. Annual growth fell below this level in 1991 on the way to zero in 1992, averaging 2.7% over 1991-2000.
Chart 4
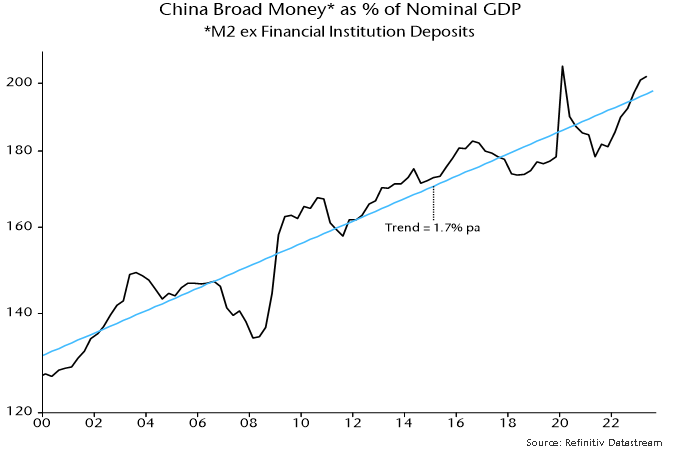
China’s broad money to nominal GDP ratio has risen at a similar trend rate of 1.7% pa – chart 5. If trend real GDP growth is assumed to be about 5%, broad money expansion needs to stay above about 7% to avoid a deflationary scenario. Annual growth is currently 11.6%, with the six-month rate of increase at 10.4% pa.
Chart 5
PMI / monetary data confirming global "double dip"
A recovery in global economic momentum into the spring has gone into reverse, with monetary trends suggesting that weakness will intensify during H2.
The global composite PMI new orders index fell sharply again in July and has now retraced half of its December-May rise – see chart 1. The relapse was foreshadowed by a decline in global six-month real narrow money momentum from a local peak in December 2022. Real money momentum retested its June 2022 low in April and has since moved sideways, suggesting a further slide in the PMI index into early Q4 followed by stabilisation.
Chart 1
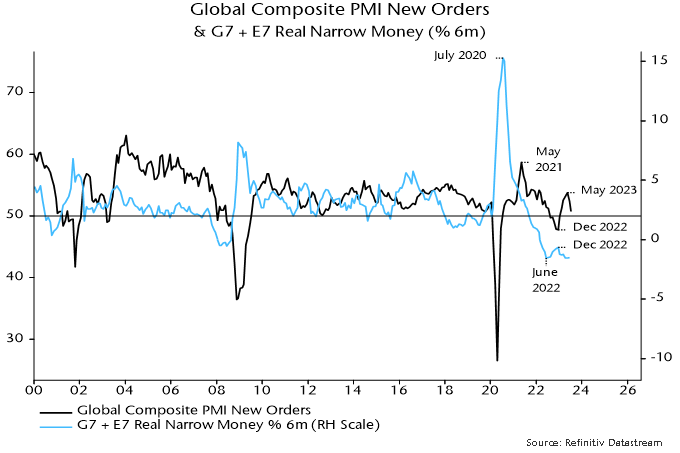
The December-May recovery in global PMI new orders was boosted by several non-monetary factors, including release of pent-up demand for services, China’s reopening and gas price relief in Europe. With similar tailwinds unlikely during H2, the orders index may retest or break the December 2022 low.
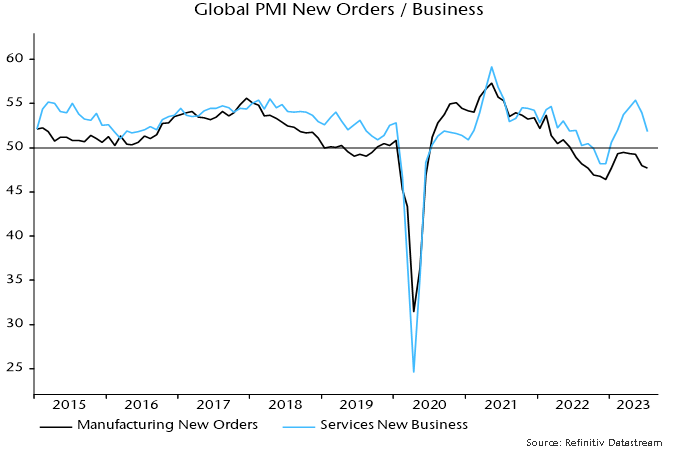
The July orders decline was paced by a slowdown in services new business, although manufacturing demand also weakened further – chart 2. The services-manufacturing gap remains wide and is expected to close via the former moving into contraction, with manufacturing possibly stabilising as the stockbuilding cycle bottoms.
Chart 2
The July PMI orders decline was broadly based across sectors. Within manufacturing, consumer goods joined investment and intermediate goods in contraction – chart 3. Services demand slowed across consumer, financial and business segments – chart 4.
Chart 3
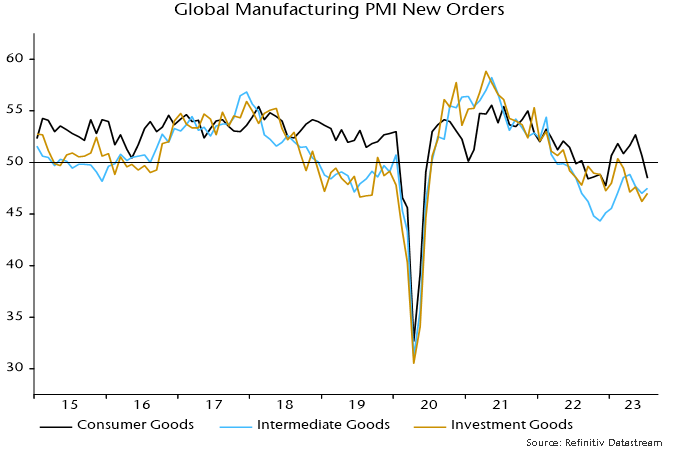
Chart 4
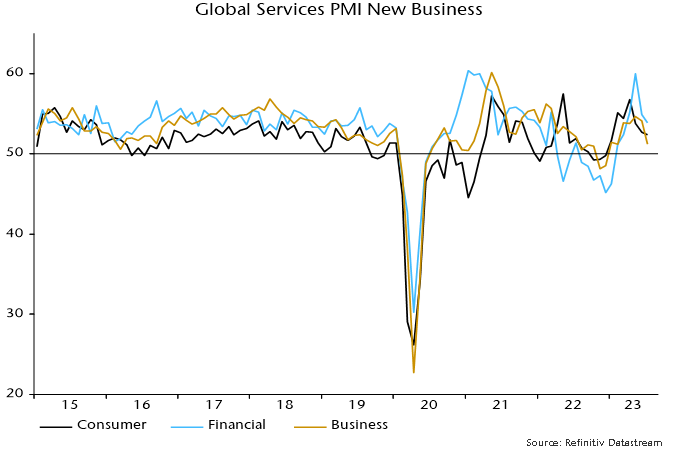
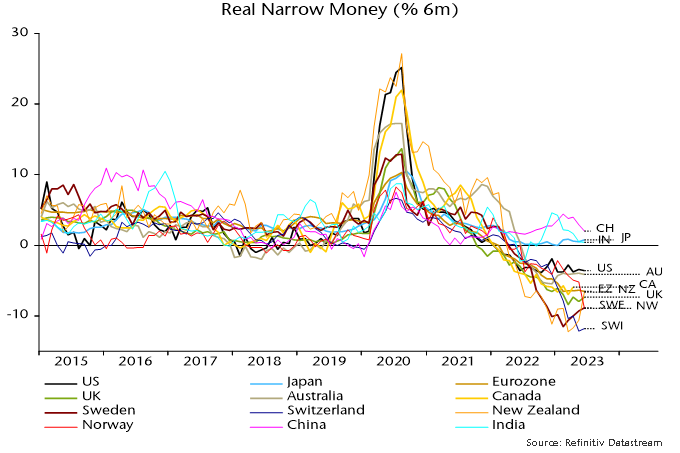
Six-month real narrow money momentum remains weakest in Europe and has slowed in China and India – chart 5. With policy tightening still feeding through, and recent oil price strength acting to slow a decline in six-month CPI momentum, global real money momentum may fail to recover during Q3.
Chart 5
Eurozone inflation on track for 2024 target return
Eurozone CPI numbers for July were deemed disappointing because annual core inflation – excluding energy, food, alcohol and tobacco – stalled at 5.5%.
Or did it? The annual rise in the ECB’s seasonally adjusted core series slowed to 5.3%, below the consensus forecast of 5.4% for the Eurostat unadjusted measure. The two gauges rarely diverge to this extent (they both recorded 5.5% inflation in June).
The six-month rate of increase of the ECB series eased to 4.7% annualised in July, the slowest since June 2022 and down from a December peak of 6.2%. Six-month headline momentum was lower at 3.4%.
As in the UK, six-month headline inflation is tracking a simplistic “monetarist” forecast based on the profile of broad money momentum two years earlier – see chart 1. This relationship suggests that six-month CPI momentum will be back at about 2% in spring 2024, with the annual rate following during H2.
Chart 1
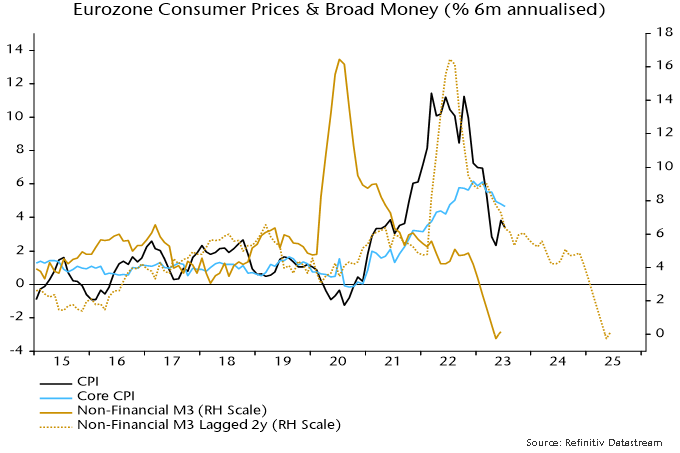
The projected return to 2% next spring is a reflection of a fall in six-month broad money momentum below 5% annualised in spring 2022. A subsequent decline in money momentum to zero suggests an inflation undershoot or even falling prices in 2025.
The shocking implication is that monetary trends were already consistent with a return of inflation to target before the ECB started hiking rates in July 2022. The 425 bp rise since then represents grotesque overkill, confirmed by recent monetary stagnation / contraction.
The corollary is that a huge and embarrassing policy reversal is likely to be necessary over the next 12-24 months, unless some other factor causes broad money momentum to recover to a target-consistent pace.
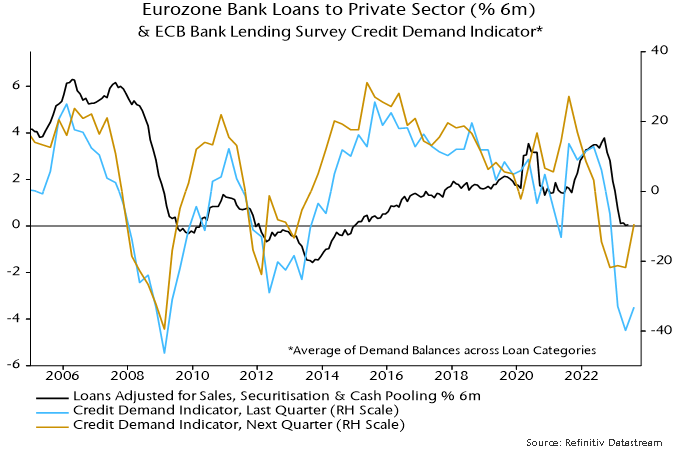
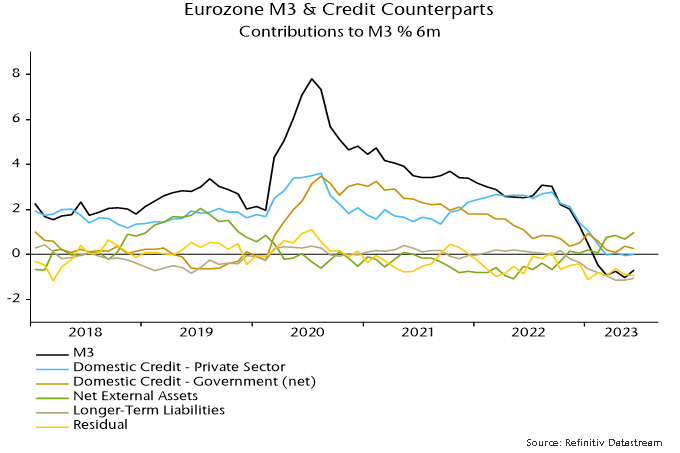
That seems a remote possibility, based on consideration of the “credit counterparts”. Loan demand balances in the latest ECB bank lending survey were less negative but still suggestive of negligible private credit expansion – chart 2.
Chart 2
Credit to government may contract given QT, withdrawal of TLTRO funding and inverted yield curves. (Banks previously used cheap TLTRO finance to buy higher-yielding government securities.) Redemptions of public sector debt held under the ECB’s Asset Purchase Programme amount to €262 billion over the next 12 months, equivalent to 1.6% of M3.
Broad money momentum has been supported recently by an increase in banks’ net external assets, reflecting a strengthening basic balance of payments (current account plus non-bank capital flows) – chart 3. This could accelerate as a Eurozone recession swells the current account surplus but is unlikely to outweigh domestic credit weakness.
Chart 3
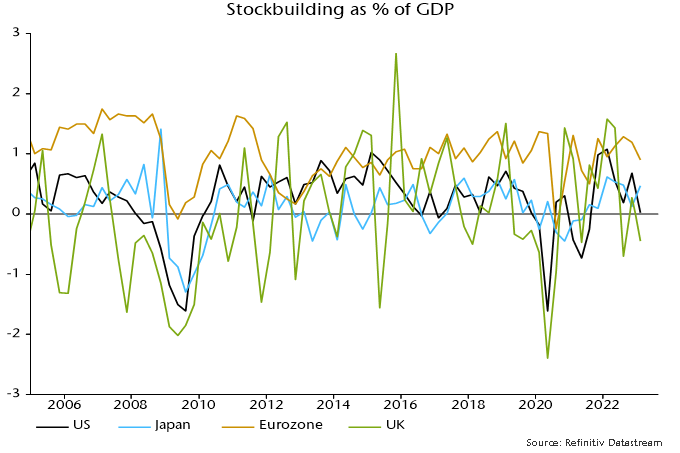
Why investors should fade a possible ISM bounce
A bottoming out of the global stockbuilding cycle could be associated with a near-term recovery in manufacturing survey indicators. Money trends suggest that any revival will be modest / temporary and offset by wider economic weakness.
Economic news has been unusually mixed since end-2021, with GDP weakness contrasting with labour market strength and manufacturing deterioration offset by services resilience. Confusing signals have contributed to market hopes of a “soft landing”.
Sectoral and regional divergences may persist in H2 2023. The expectation here is that manufacturing survey weakness will abate but labour market data will worsen significantly. Money trends continue to cast strong doubt on soft landing hopes. Europe is likely to underperform the US.
The US ISM manufacturing new orders index – a widely watched indicator of industrial momentum – hit a low of 42.5 in January and retested this level in May before recovering to 45.6 in June.
Reasons for expecting a further rise include:
-
The index has been in the 40s since September 2022 and the mean duration of sub-50 periods historically was eight months (ignoring episodes of three months or less).
-
The global stockbuilding cycle remains on track to bottom out during H2 2023 and lows historically were usually preceded by a recovery in US / global manufacturing new orders.
-
Recent price falls for raw materials and other production inputs may further incentivise firms to step up purchasing to maintain or replenish inventories.
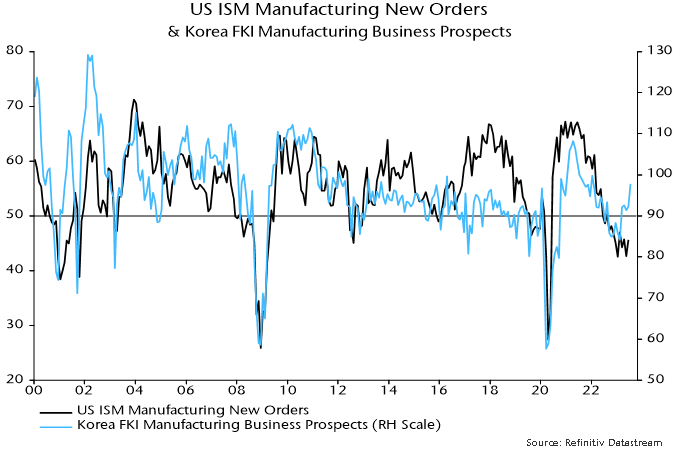
Korean manufacturing is a bellwether of US / global trends and the latest Federation of Korean Industries survey reported a marked improvement in optimism, consistent with ISM new orders moving back above 50 – see chart 1.
Chart 1
Sustained recoveries in ISM new orders from the mid 40s into expansionary territory historically occurred against a backdrop of positive and / or rising six-month real narrow money* momentum. Current trends are unfavourable, with momentum still significantly negative and moving sideways – chart 2.
Chart 2
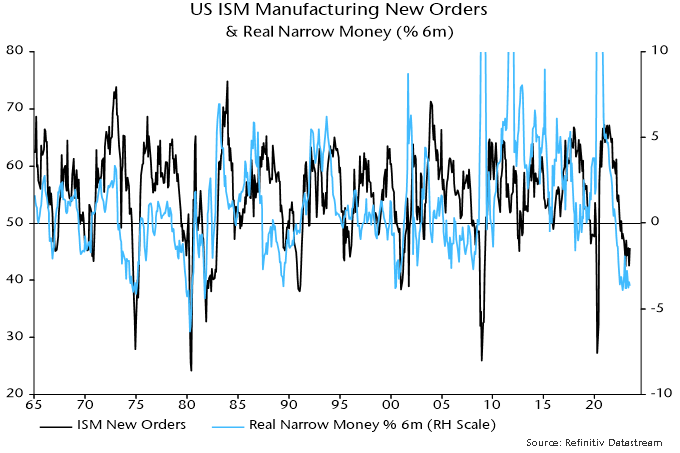
Examples of recoveries to above 50 without a supportive monetary backdrop include 1970 and 1989-90. In both cases the rise was modest (peaking below 55), short-lived and followed by a decline to a lower low. The recovery in 1970 occurred within an NBER-defined recession and in 1989-90 just before one.
An ISM rebound might not be mirrored by much if any revival in European manufacturing surveys. Money trends are even weaker than in the US, while the stockbuilding adjustment started later in the Eurozone and probably has further to run – charts 3 and 4.
Chart 3
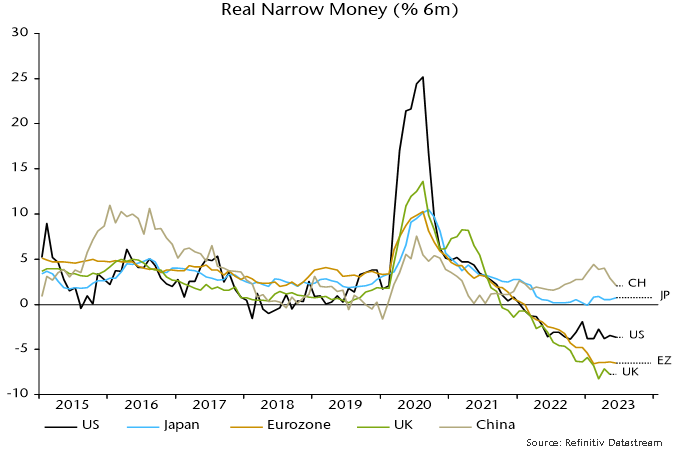
Chart 4
*Narrow money definition used here = M1A = currency + demand deposits.
Why UK inflation underperformance could be ending
UK headline CPI momentum continues to track a simplistic “monetarist” forecast based on the profile of broad money momentum two years earlier.
Six-month growth of headline prices, seasonally adjusted, peaked at 12.7% annualised in July 2022 and had halved to 6.5% as of June. This mirrors a halving of six-month broad money momentum from a peak of 20.5% annualised in July 2020 to 10.5% in June 2021 – see chart 1.
Chart 1
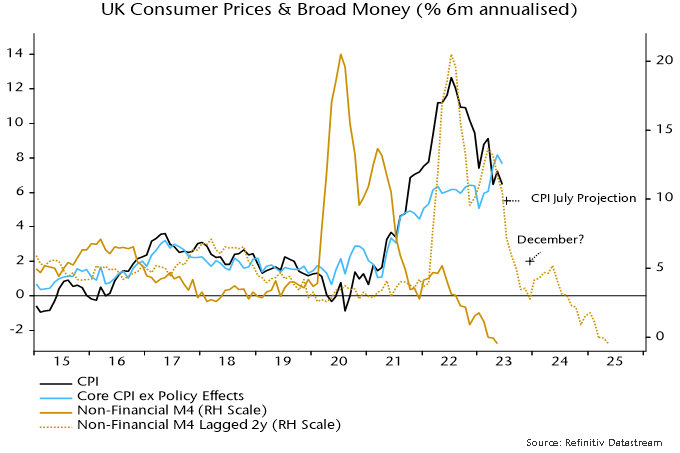
Broad money continued to slow sharply during H2 2021, with six-month momentum down to 2.7% by December, suggesting a fall in six-month CPI momentum to 2% annualised or lower by late 2023 / early 2024.
A 2% rate of increase of prices during H2 2023 could be achieved by the following combination:
The energy price cap falling by a further 10% in October, in line with current estimates based on wholesale prices, following the 17% July reduction.
Food, alcohol and tobacco prices slowing to an 8% annual inflation rate by December from 14.9% in June.
Core prices rising at a 4% seasonally adjusted annualised rate during H2 2023, down from 7.7% in H1.
The latter two possibilities are supported by producer output price developments – annual inflation of food products is already down from a 16.8% peak to 8.7%, while core output prices flatlined during H1, following a 6.4% annualised rise during H2 2022.
A 2% annualised CPI increase during H2 2023 would imply a headline annual rate of about 4% by year-end, well with PM Sunak’s target of a halving from 10%+ levels, although he will have made no contribution to the “success”.
Why has UK CPI inflation exceeded US / Eurozone levels, both recently and cumulatively since end-2019?
The assessment here is that the divergence reflects relatively weak UK supply-side economic performance and a larger negative terms of trade effect, rather than more egregious monetary excess.
Charts 2 and 3 show that UK / Eurozone broad money expansion since end-2019 has been similar and less than in the US, with the relative movements mirrored in nominal GDP outcomes.
Chart 2
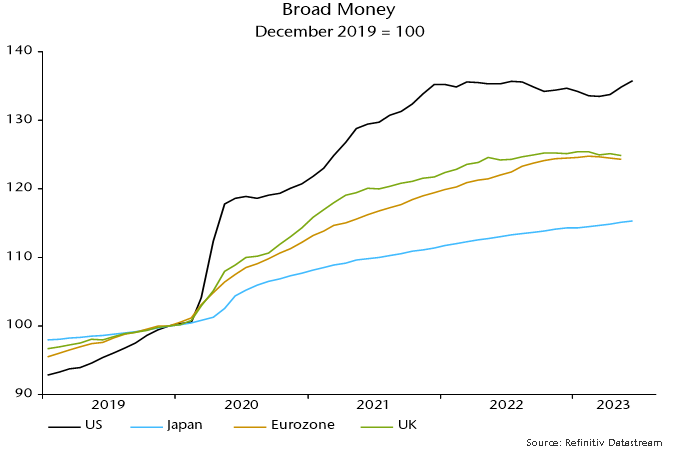
Chart 3
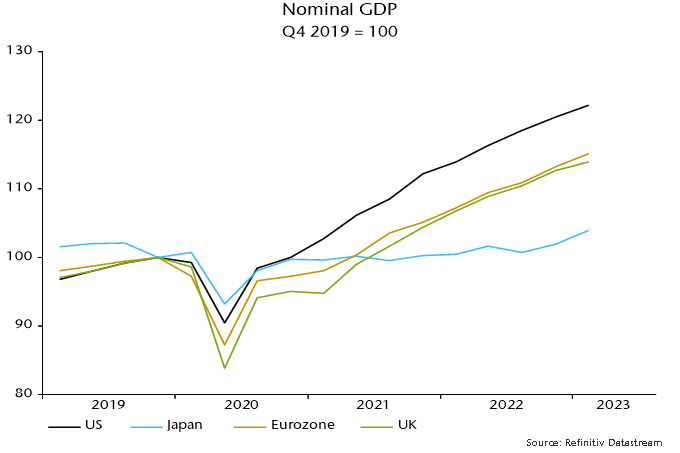
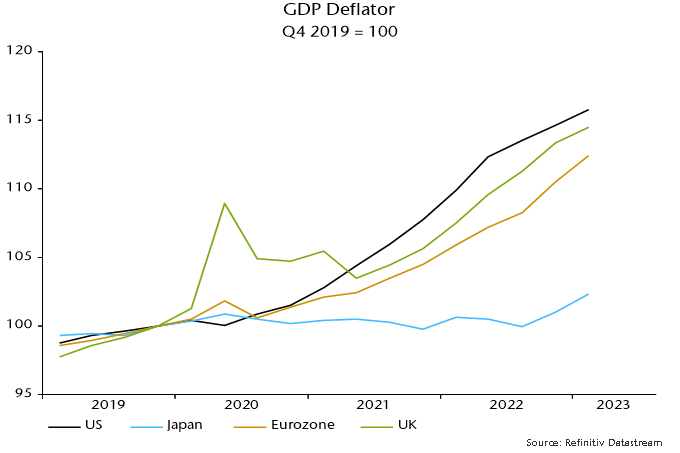
The UK has, however, underperformed the US and Eurozone in terms of the division of nominal GDP expansion between real GDP and domestically-generated inflation, as measured by the GDP deflator – charts 4 and 5.
Chart 4
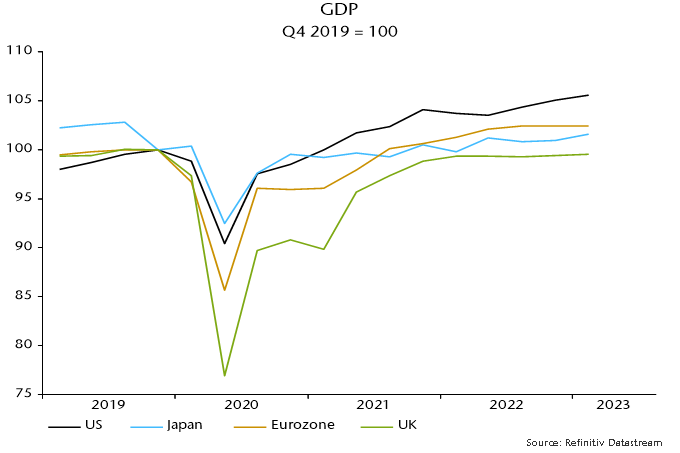
Chart 5
UK consumer prices were additionally boosted relative to the US by opposite movements in the terms of trade (i.e. the ratio of export to import prices), reflecting different exposures to energy prices as well as currency movements (i.e. a strong dollar through last autumn) – chart 6.
Chart 6
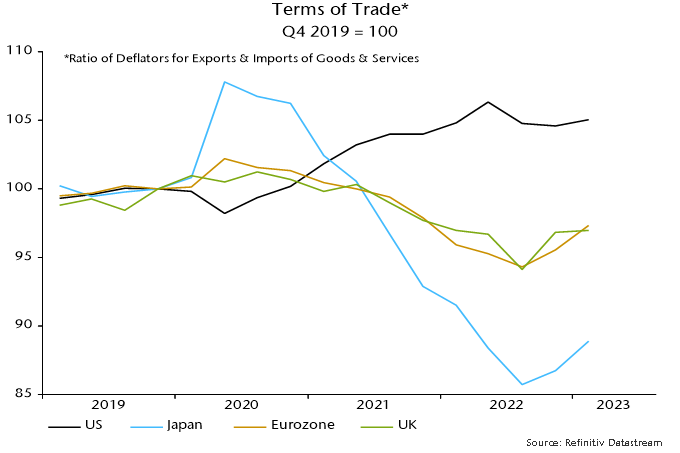
UK supply-side weakness may be structural but monetary and terms of trade considerations suggest an improvement in UK relative inflation performance – annual broad money growth is now similar to the US and below the Eurozone level, while sterling appreciation since late 2022 may extend a recent recovery in the terms of trade.