
Global real money momentum at new low on BRIC weakness
 Simon Ward
 Post a Comment
Additional monetary information confirms an earlier estimate here that global (i.e. G7 plus E7) six-month real narrow money momentum reached a new low in September, extending a decline from a local peak in December 2022 and suggesting further economic deceleration through spring 2024.
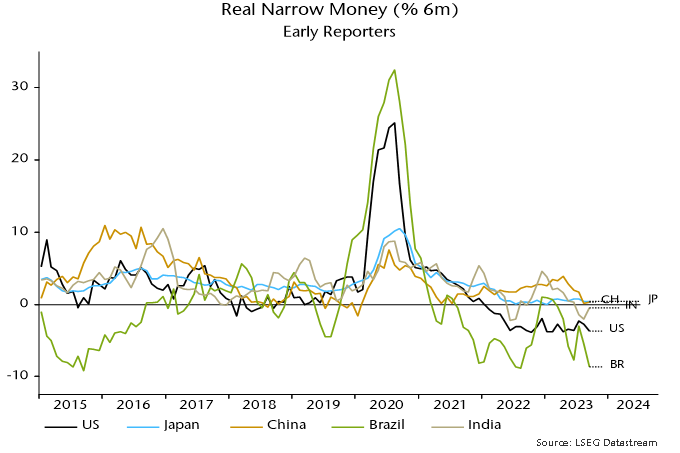
The September decline reflects a further fall in E7 momentum, which offset a small G7 recovery and reduced the E7-G7 gap to its narrowest since August 2022 – see chart 1.
Chart 1
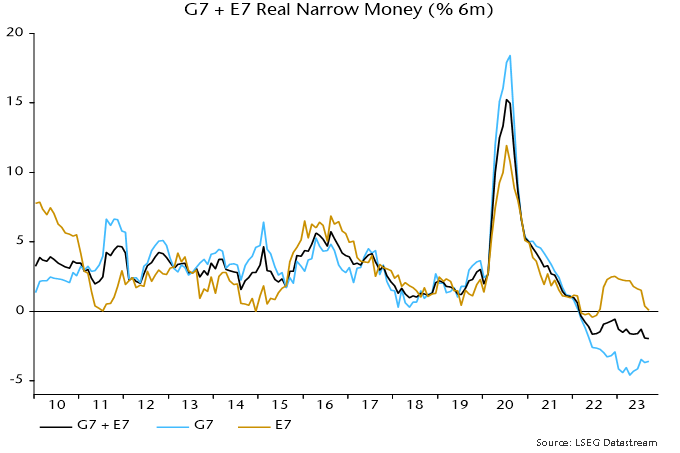
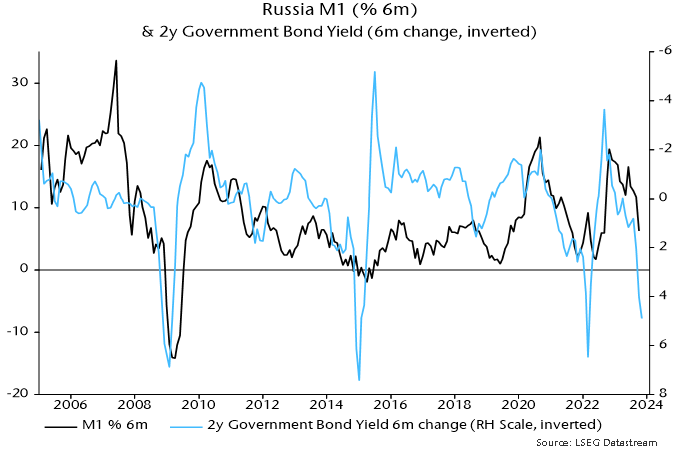
E7 and G7 gauges have moved in opposite directions since April. The E7 decline over May-August was driven by China, India and Brazil, with the September fall due to a plunge in Russia – chart 2. Russian weakness is likely to intensify given a recent surge in rates – chart 3.
Chart 2
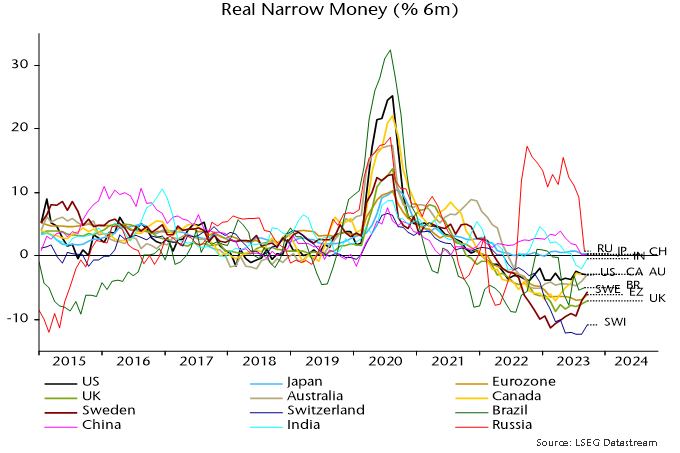
Chart 3
The G7 recovery since April has been due to a minor reduction in the pace of nominal narrow money contraction coupled with a further slowdown in six-month consumer price inflation. The change of direction has occurred in most DM economies and momentum remains weaker in the Eurozone / UK than the US, Canada and Australia – chart 2. Still-extreme negative readings argue against much diminution of recessionary prospects.
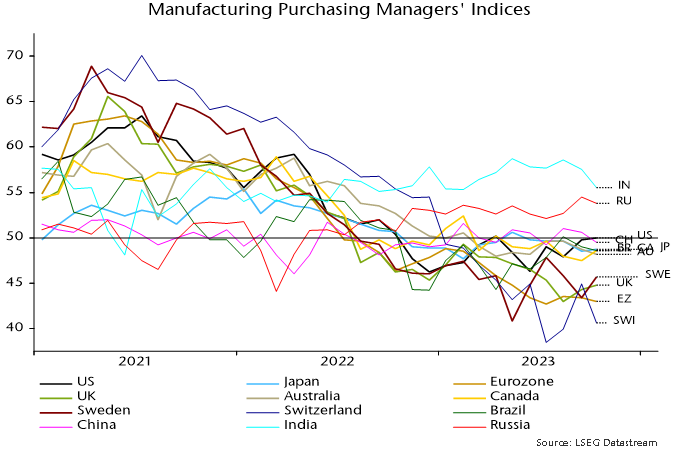
Cross-country S&P Global manufacturing PMI results are broadly consistent with the real narrow money momentum ranking – chart 4 (rank correlation coefficient of latest data points in charts 2 and 4 = 0.85). October PMI falls in India, China, Brazil and particularly Russia may extend given weaker monetary readings. A recent recovery in the US PMI, meanwhile, appears out of line with negative / little changed real money momentum and could reverse (as did the ISM manufacturing PMI last month).
Chart 4
UK M4ex distorted but money trends still alarming
UK money trends are recessionary / deflationary but not as disastrous as suggested by the Bank of England’s M4ex broad money measure, which plunged 4.2% in the year to September after a 0.6% annual decline in August.
M4ex includes money holdings of non-bank financial corporations (excluding intermediaries such as central clearing counterparties, hence M4ex). These holdings surged in September 2022 as LDI funds scrambled to raise cash to meet collateral requirements, creating an unfavourable base effect for the annual M4ex change in September 2023.
The long-standing practice here has been to focus on non-financial monetary aggregates, where available, because movements in financial sector money holdings can be erratic and usually have little bearing on near-term economic prospects.
Non-financial M4, encompassing money holdings of households and private non-financial businesses, fell by 0.1% between August and September for an annual decline of 0.7% compared with 0.3% the previous month – see chart 1.
Chart 1
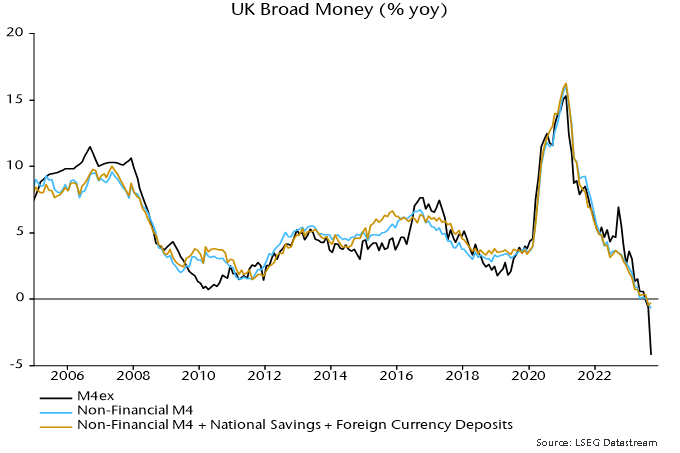
The monthly movements in M4ex and non-financial M4 in September were depressed by savers shifting funds out of bank deposits into high-yielding National Savings growth bonds (now withdrawn). The impact of National Savings flows on annual changes has been minor, however: an expanded non-financial measure including National Savings and foreign currency deposits fell by 0.3% in the year to September – chart 1.
The LDI crisis distortion to the annual M4ex change will unwind in October / November – money holdings of non-bank financial corporations declined by £51 billion in October / November 2022 after a £65 billion jump in September.
Hard landing watch: recent data wrap
October flash PMI results for major developed economies imply little change in the global composite PMI new orders index (released 6 November). The current index level is 1 standard deviation below the long-run average. Weakening real narrow money momentum suggests a further decline through end-Q1 2024 – see previous post.
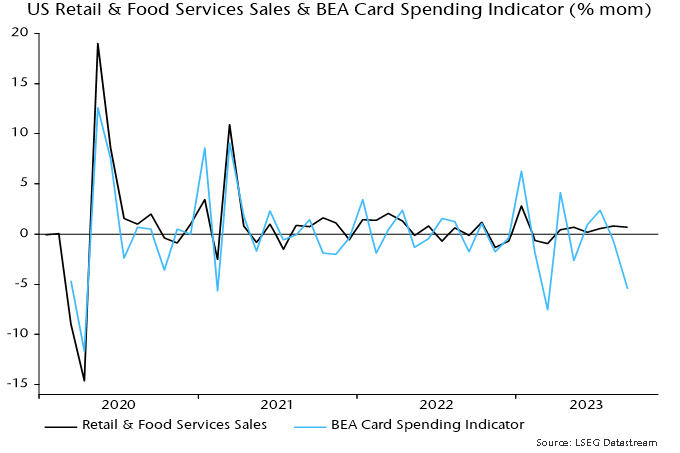
What to make of the US GDP surge of 4.9% annualised in Q3? Likely temporary factors contributed (strong government spending, a rebound in stockbuilding). National accounts numbers have jarred with talk of economic strength since end-2021: GDP rose at an annualised rate of 1.2% over the six quarters to Q2 2023, with growth of the alternative income measure at just 0.2%. The Q3 GDP number may represent a statistical catch-up (an income estimate will be released next month).
Retail sales / consumption strength is difficult to reconcile with the BEA’s near real-time data on card spending – see chart 1. Similarly, the GDP number appears out of line with PMIs and moderate Q3 growth in private aggregate hours worked (1.7% annualised).
Chart 1
Chinese Q3 GDP growth also surprised to the upside but is easier to explain – as payback for a weak Q2. The two-quarter rate of change fell again – chart 2. A decline in six-month real narrow money momentum during Q3 suggests a further slowdown into early 2024.
Chart 2
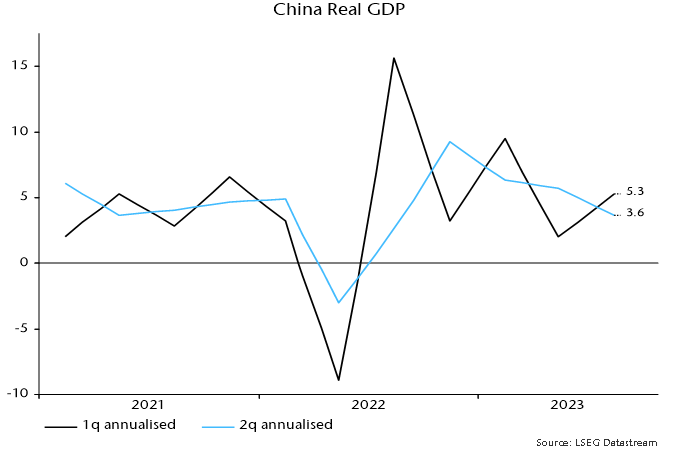
Verdict: PMIs consistent with soft or hard landing; US GDP strength temporary / erratic; China losing momentum.
Food correction to sustain rapid UK / Eurozone inflation decline
Changes in household energy bills will cut 1.6 percentage points (pp) from UK annual CPI inflation between September and October, implying a drop from 6.7% to 5.1% if annual rates of increase of other components are unchanged. Slowing food prices promise to lop a further 1.5 pp off annual inflation by early 2024, both directly and via pass-through to the important catering services component. So a minimum expectation is that the headline rate will be back at about 3.5% by next spring, before allowing for likely moderation in other inflation components.
The energy bill effect in October reflects the dropping out of a 25% increase in October 2022 along with a 7% cut in the price cap this month. The annual rate of change will swing from 6% in September to -22%. A simple calculation would suggest a 1.3 pp impact on headline CPI inflation, i.e. the 28 pp swing multiplied by a published weight of 4.8%. It turns out that the actual impact is larger because of the way that monthly price changes have interacted with variations in the weight due to relative price movements and basket revisions.
Annual inflation of food, beverages and tobacco has moderated but was still up at 11.8% in September. The CPI measure tracks the corresponding PPI component, annual inflation of which is now below 5% (4.5% in September) – see chart 1.
Chart 1
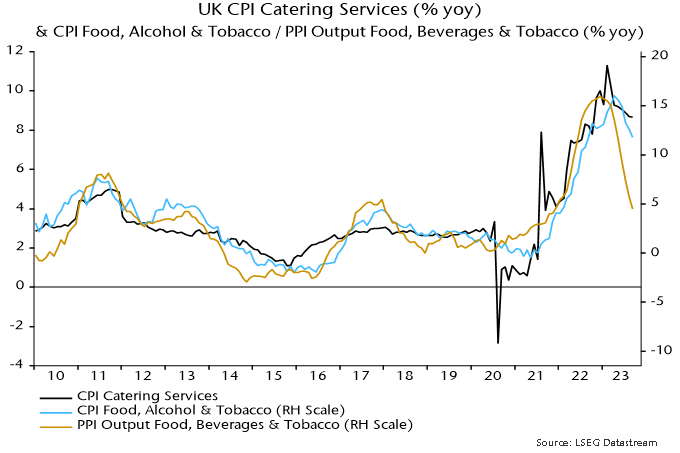
A fall in annual inflation of the CPI food measure to 5% by early 2024 would suggest a 1.1 pp impact on the headline rate, i.e. the 6.8 pp fall from the September multiplied by a published weight of 16.1%*.
As the chart shows, however, food prices are also a key driver of the catering services component, which has a 10.9% weight. The beta of this component to food prices has been about 0.5 historically, i.e. the suggested fall of 6.8 pp in annual food inflation would be expected to lower catering services inflation by 3.4 pp, cutting a further 0.4 pp from the headline rate.
Central bankers and commentators worried about sticky services inflation underestimate the pass-through effects of energy and food prices. Catering services accounts for 23.4% of the services basket, so the suggested 3.4 pp drop in the annual increase would cut 0.8 pp from annual services inflation (6.9% in September).
The above analysis also applies to the Eurozone, although the estimated impacts are smaller because annual inflation of food, beverages and tobacco is lower than in the UK, i.e. 8.8% versus 11.8% in September.
As in the UK, a slowdown in the corresponding PPI component suggests a fall in annual food inflation to 5% soon – chart 2. A 3.8 pp reduction would imply a 0.8 pp cut in headline inflation, based on a 20.0% weight.
Chart 2
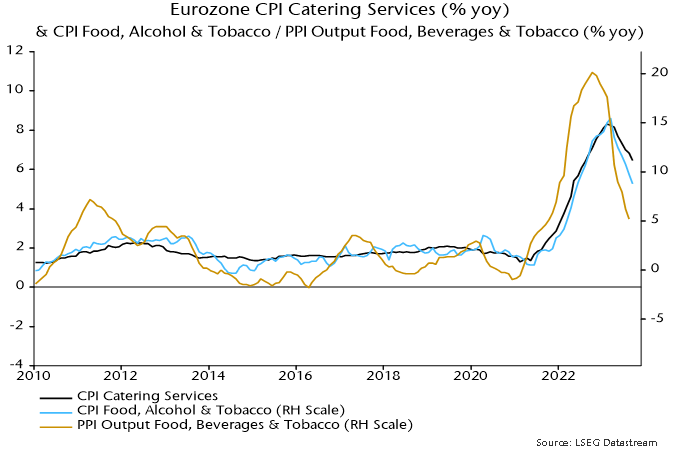
Eurozone catering services inflation also has a beta of about 0.5 to food prices, so could fall by 1.9 pp. This would cut a further 0.2 pp from the headline rate and 0.4 pp from services inflation (based on weights of 8.4% and 19.2% in the overall and services baskets respectively).
So the combined direct and indirect effects of the food slowdown on CPI inflation would be about 1.0 pp in the Eurozone against 1.5 pp in the UK.
*As with the energy effect, a detailed calculation yields a slightly larger impact.
More negative monetary news
Global six-month real narrow money momentum – a key leading indicator in the forecasting approach employed here – is estimated to have fallen to another new low in September. Real money momentum has led turning points in global PMI new orders by an average 6-7 months historically, so the suggestion is that a recent PMI slide will extend through end-Q1 – see chart 1.
Chart 1
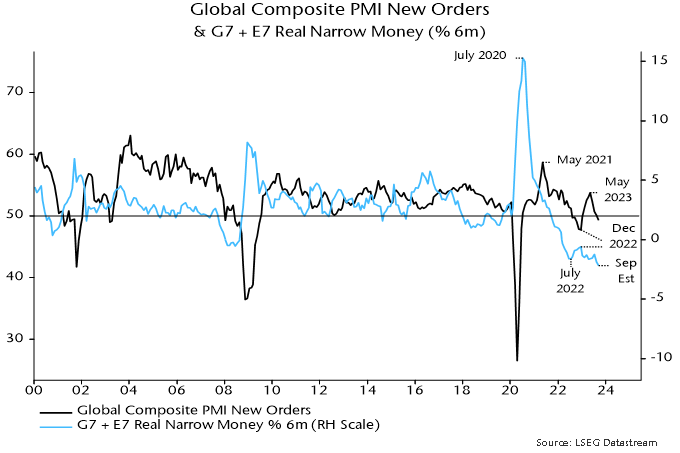
The September real narrow money estimate is based on monetary data for countries with a two-thirds weight in the global (i.e. G7 plus E7) aggregate and CPI data for a higher proportion.
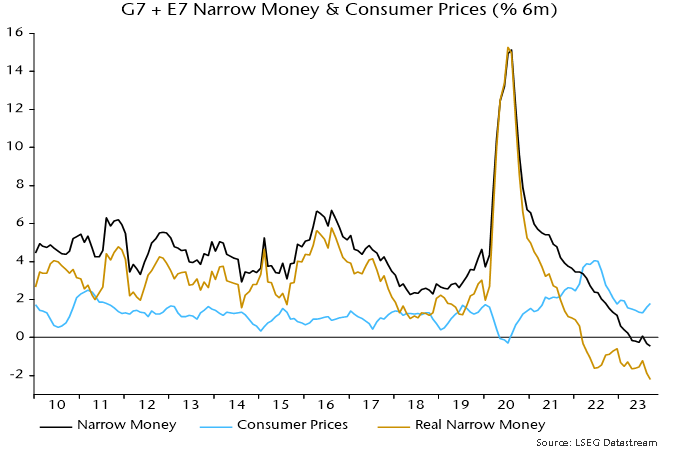
The estimated September fall reflects additional nominal money weakness coupled with a further oil-price-driven recovery in six-month CPI momentum – chart 2.
Chart 2
Among countries that have released September data, six-month real narrow money momentum fell in the US and Brazil, was little changed in China / Japan and recovered in India (because inflation reversed lower after a food-driven spike) – chart 3.
Chart 3
Real narrow money momentum is primarily a directional indicator but the current extreme negative reading seems unlikely to be consistent with hopes of a “soft landing”.
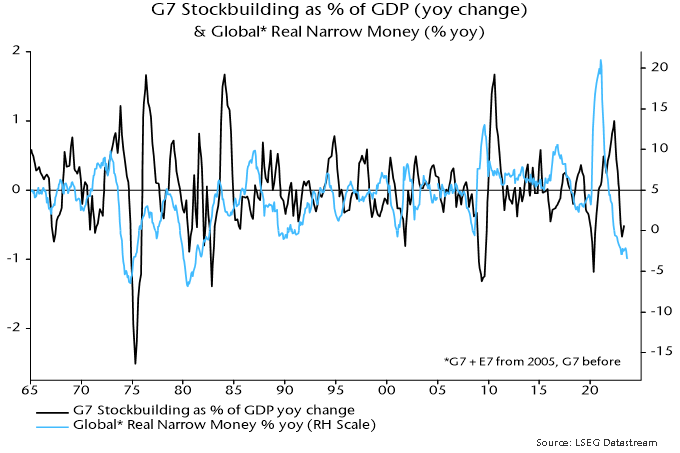
One argument for the latter is that a drag on manufacturing trade and activity from a downswing in the stockbuilding cycle is coming to an end, to be followed by a recovery into 2024. A trough by end-2023 has long been the base case here but monetary weakness suggests that the cycle will bump along the bottom rather than enter an upswing.
More precisely, an initial boost from an ending of destocking may fizzle as the usual multiplier effects are offset by slower or falling final demand due to monetary restriction.
Stockbuilding cycle upswings historically were always preceded by a recovery (of variable magnitude) in global real narrow money momentum – chart 4.
Chart 4
Current conditions are reminiscent of the early 1990s, when real money momentum remained near its low between H2 1989 and H1 1991 and an easing of a stockbuilding drag in 1990 was followed by a relapse into 1991. Monetary weakness, on that occasion, appears to have resulted in an extended cycle, with a final low in Q2 1991 occurring 4 1/2 years after the previous trough in Q4 1986 versus an average cycle length of 3 1/3 years. For comparison, the current cycle started in Q2 2020 so has recently moved beyond the 3 1/3 year average.